Increase Sales Conversion
Can’t turn your site traffic into sales?
Reduce Cart Abandonment
Your customers abandoning their carts?
Promote Products & Offers
Make potential customers notice special offers.
Collect Form Submission
Struggling to collect form submissions?
Get More Phone Calls
Let them call you directly via popups.
Grow Email List
Having trouble growing your email list?
Gamify Your Campaign
Choose your offer and let the game begin.
Make Announcement
Make sure important news unmissed.
Increase User Engagement
Keep visitors & customers on your site longer.
Collect Feedback & Surveys
Can’t draw attention to your surveys?
Facilitate Social Sharing
Grow social media followers and likes!
# What Metrics Can I Find on The Analytics Page
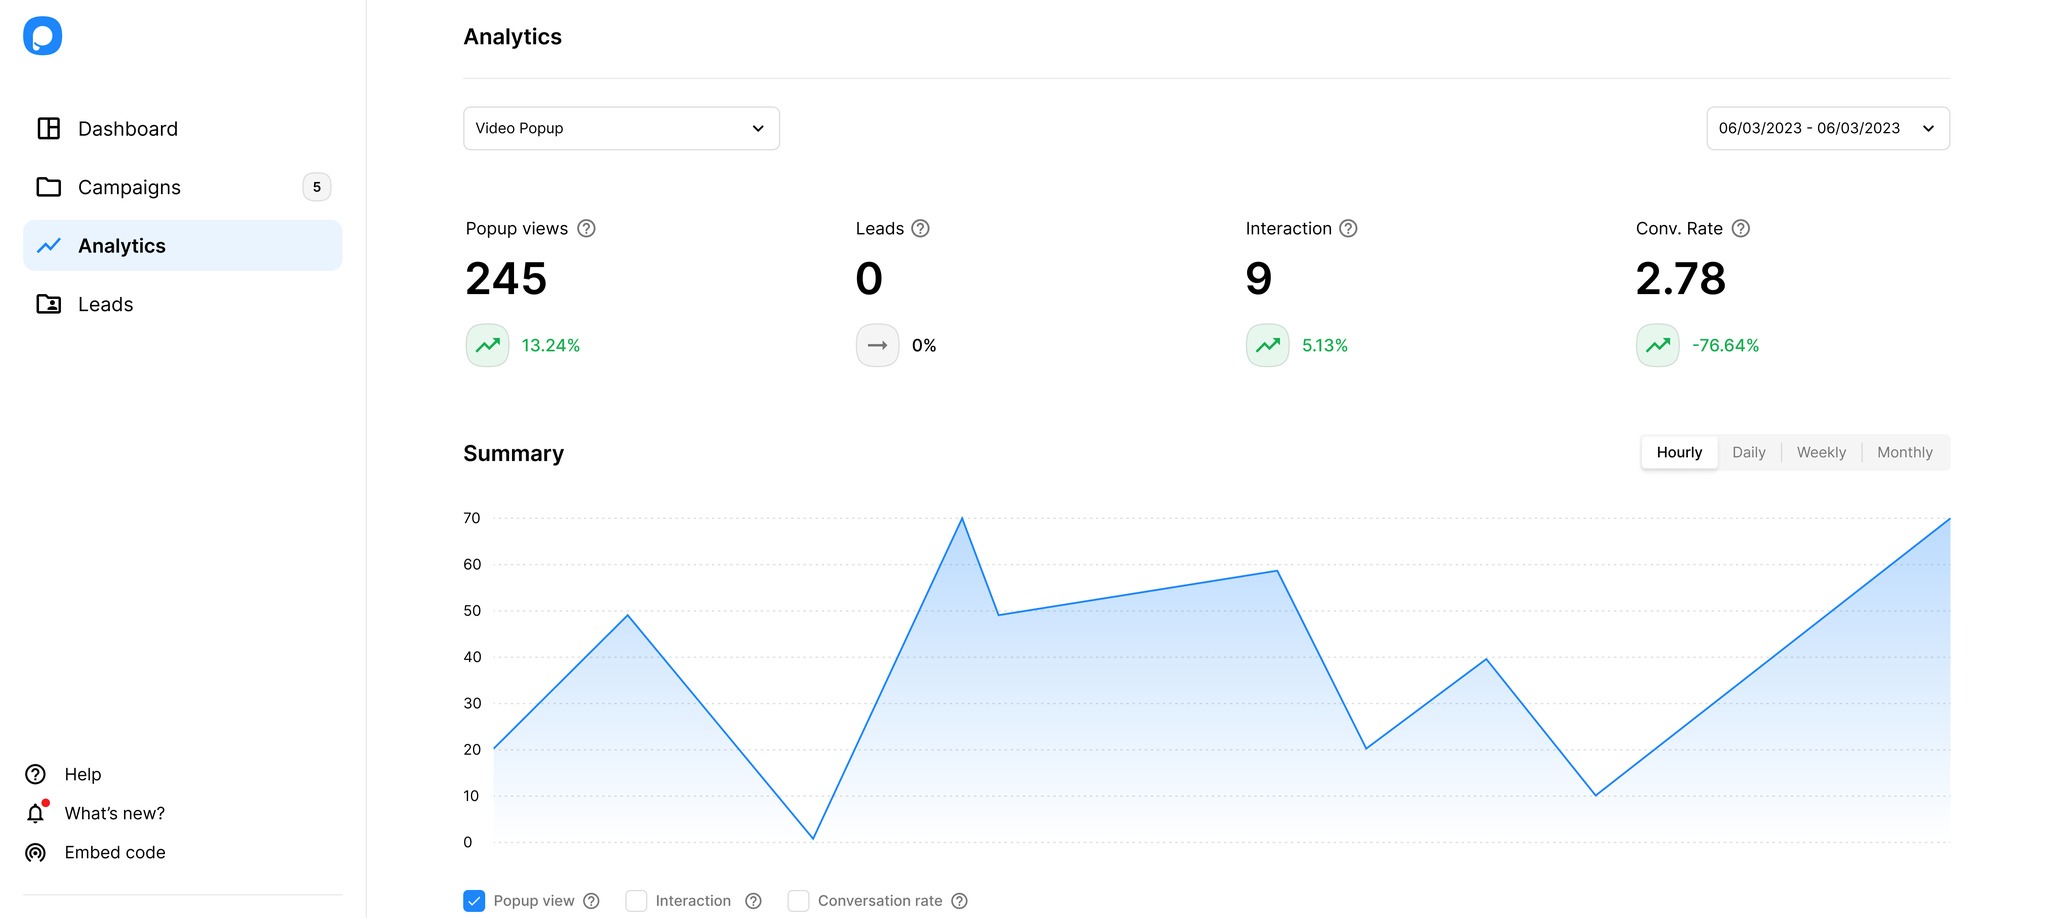
Use the Analytics page to see the performance of your popup campaigns in one place and how close your visitors are to reach your goal after seeing the campaigns.
The Analytics page, which you can find on your Dashboard, contains advanced and detailed data.
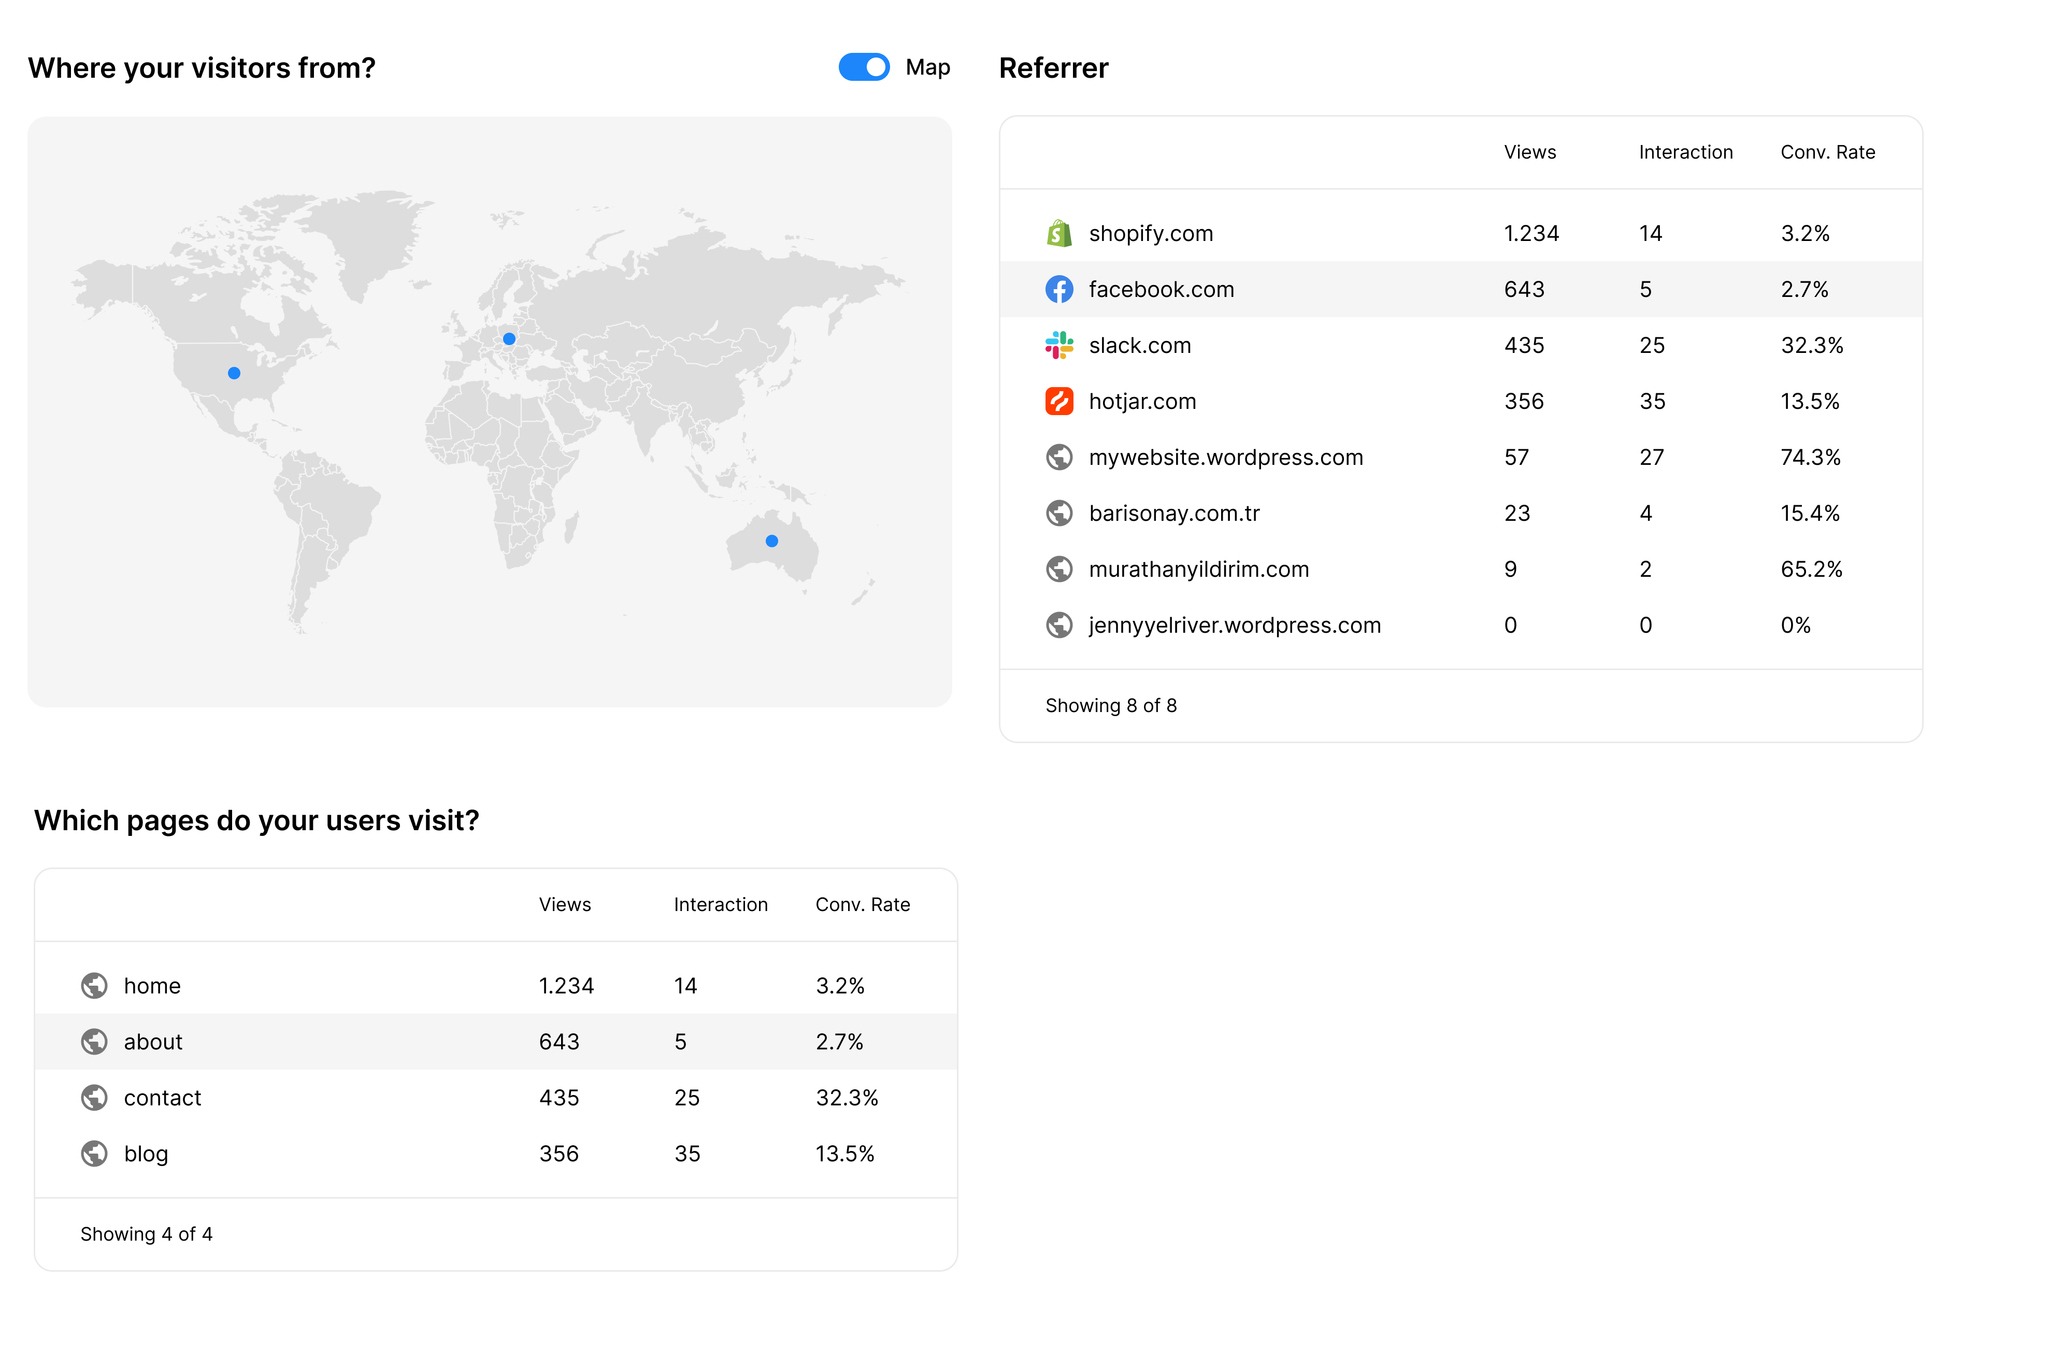
You can see where your potential customers come from geographically to your website, from which online source they came to your site, which browser and device they use, and even the resolution details.
# Popupsmart’s Analytics Glossary

❇️ Popup Views: A popup view is the amount of total popup view requests from your added websites.
Popup view refers to the number of times a popup is displayed to the user.
Note: Multiple popup views to the same person are counted.
How to view your remaining Popup View number
Your popup view quota is defined for your account and set based on your subscription plan. You can see the remaining popup view numbers for your account on your dashboard. Hover over your Account and check the view numbers.
❇️ Leads: It shows the total converted form data through the popup.
❇️ Interaction: It refers to the total clicks on the popup. If you check “Count as interaction” on your form elements, these will be included in the interaction metric. Note that clicks to close actions are not counted as interactions.
❇️ Conversion Rate: A conversion rate is the percentage of the total number of people who completed the desired action through your popup, such as filling out the form or subscribing to your mailing list.
Conversion Rate (%) = Total Interactions ÷ Total Website Visits * 100
For example, if 100 visitors view/ visit your website and 30 people interact with your popup, 30% is your conversion rate.
If you want to have more details, you can take a look at Conversion Rate Optimization Guide.

❇️ Geographical Area Analytics: See the geographical location of the users viewing the campaign on the world map or as a list. To change the display options, simply swipe the toggle. Seeing which geographic location the users are from will help you with your campaign targeting.
❇️ Referrer: See which sources users came from when they first entered your site and the number of views and interactions, and the conversion rate of your popup campaign by source.
❇️ Pages Users Visit: See on which pages on your site users have seen your popup campaign, the number of interactions, and the conversion rate of the campaign by page.


